US Existing-Home Sales Hit a 16-Year Low in October — What 7% Mortgage Rates Are Doing to Buyers
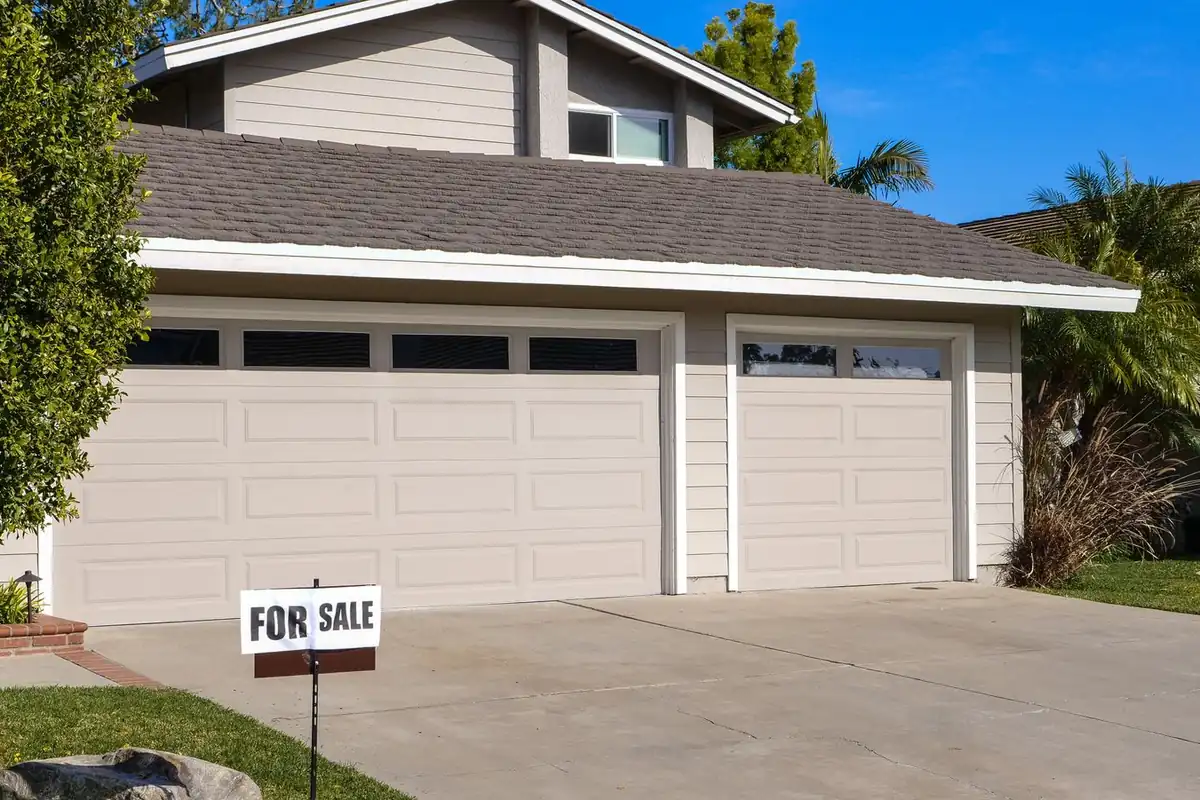
Existing-home sales fell to their lowest level in more than 16 years in October, the National Association of Realtors reported on Thursday, November 12. Sales dropped 5.5% from September to a seasonally adjusted annual rate of 3.75 million — the slowest pace since August 2010, down 8.8% from a year earlier, and below the 3.85 million economists expected. The cause is not a mystery: mortgage rates averaged 7.33% in October, the highest in a generation, and the buyers who signed contracts in August and September simply could not make the math work. This post walks through the numbers in the NAR report, what that rate level does to a real monthly payment, and why the first signs of relief are now showing up in the weekly rate data.
The miss was broad. Sales fell from September in the Midwest, South and West and held steady in the Northeast, and they were down from a year earlier in all four regions. September’s pace was also revised down, to 3.97 million. The full release is at the National Association of Realtors. The sales freeze is the housing side of the same story told by Tuesday’s inflation report — our account of the hot October CPI and the December Fed hike odds explains why rates are stuck where they are.
What the October report actually showed
Existing-home sales are counted at closing, so October’s number is really a picture of the late-summer market: most of these sales went under contract in August and September, when mortgage rates were at their worst for the year. Read with that lag in mind, the report is less a surprise than a receipt.
| Measure | October 2026 | What to know |
|---|---|---|
| Existing-home sales (annual rate) | 3.75 million | -5.5% vs September, -8.8% vs a year ago; consensus was 3.85M; lowest since Aug 2010 |
| Median existing-home price | $416,700 | +0.4% vs a year ago ($414,900); -0.4% vs September ($418,200) |
| Homes for sale (inventory) | 1.59 million | +1.3% vs September, +4.6% vs a year ago |
| Months of supply | 5.1 months | Up from 4.7 in September and 4.4 a year ago |
| 30-year fixed rate, October average | 7.33% | Peaked near 7.40% mid-month |
Two lines matter most. The first is the sales pace itself: at 3.75 million, the market is moving fewer homes than at any point since the housing bust’s long hangover in 2010. The second is the supply line quietly building underneath it — 5.1 months of inventory is the most breathing room buyers have had in years, and it is still rising. A frozen market is slowly stocking the shelves for whoever buys next.
Why did sales fall to a 16-year low?
NAR’s chief economist, Lawrence Yun, put it plainly in the release: home buying is difficult when mortgage rates have climbed to their highest levels since 2000, aside from a single month in 2023. The 30-year fixed rate averaged 7.33% across October and peaked near 7.40% in mid-October. At those levels, the monthly payment on a median-priced home eats a share of income that most households cannot stretch to — and because October’s closings were agreed in August and September, the report captures buyers signing at the very top of the rate market.
Prices gave buyers no help. The median price still rose 0.4% from a year earlier, because the same high rates that freeze buyers also freeze sellers: a homeowner sitting on a 3% or 4% mortgage has little reason to list, move and borrow again at 7%. That lock-in keeps inventory scarce in the neighbourhoods buyers actually want, even as the national supply number climbs. The result is the market’s strange split personality — the fewest sales in 16 years, and prices that still will not fall.
What does October’s 7.33% average do to a payment?
Put the rate on a real house. The median existing home sold for $416,700 in October. With 20% down ($83,340), the loan is $333,360 over 30 years. Here is principal and interest at October’s average rate — and at the 7.11% Freddie Mac reported this week:
| 30-year fixed rate | Monthly principal & interest on $333,360 | Interest over 30 years |
|---|---|---|
| 7.33% (October average) | $2,292.22 | $491,839 |
| 7.11% (Freddie Mac, Nov 12) | $2,242.53 | $473,952 |
The difference between the rate October’s buyers actually faced and this week’s rate is $49.69 a month — and roughly $17,887 of interest across the life of the loan. That is the size of the rate problem in household terms: not abstract basis points, but about $50 a month of breathing room that vanished at exactly the moment buyers were signing. Run your own price and down payment through our mortgage calculator to see the same math on the home you are looking at.
Are mortgage rates already coming back down?
There is an early sign of relief. Freddie Mac’s Primary Mortgage Market Survey, released the same morning as the NAR report, put the 30-year fixed rate at 7.11% for the week ending November 12 — a fourth straight weekly decline from 7.18%, and the lowest weekly average since late September. The monthly average tells you what October’s buyers paid; the weekly survey tells you where the market is heading now, and for four weeks it has been heading down. We track every weekly reading in our weekly mortgage rate snapshot; the official survey is at Freddie Mac.
Do not over-read it. A 7.11% rate is relief only by comparison — it is still a rate that produced a 16-year sales low a month ago. And the December 8–9 Federal Reserve meeting hangs over the trend: with October inflation running hot, hike odds for December are high, and a hike surprise would end the weekly slide quickly. The path from here runs through that meeting.
Why aren’t prices falling if sales are?
If demand has collapsed, the textbook says prices should follow. So far they have not: the median price rose 0.4% from a year ago even as sales fell 8.8%, and it slipped only 0.4% from September. The reason is the supply side of the freeze — sellers are as locked in as buyers are locked out — plus the slow build in inventory, which at 5.1 months has not yet reached the level that forces broad price cuts.
The forward-looking data is softer than the closing data. Redfin’s latest weekly figures show pending sales — contracts being signed now — down 15.54% from a year earlier, a record low in their records since 2021. Pending sales are tomorrow’s closings, so the freeze has not thawed yet at the contract stage. Our weekly coverage of home prices falling for a third straight week and our earlier report on pending sales at a 25-year low track how the two series have been diverging.
Should you buy now or wait?
- Buying this winter: your negotiating room is growing. Inventory at 5.1 months and falling sales mean listed homes sit longer. Price your offer on today’s 7.11%, not October’s 7.33% — and re-run your numbers first with our guide to buying now or waiting as a first-time buyer.
- Waiting for lower rates: know what you are waiting for. A move from 7.33% to 7.11% is worth about $50 a month on a median-priced home. A bigger fall would help more, but every month of waiting is a month of rent — and the pent-up demand NAR points to means cheaper rates would bring competing buyers back with you.
- Selling: price to the rate buyers actually face. October’s buyers signed at 7.33% and walked away in record numbers. Homes priced for last year’s payment math are the ones still sitting.
- Already own at a high rate: watch the weekly survey. If you borrowed near October’s peak, the slide to 7.11% is the start of a refinance conversation, not the end of one — the gap needs to cover your closing costs before the math works.
What to watch next
- Every Thursday — Freddie Mac’s weekly survey. Whether the 30-year holds below 7.11% or the four-week slide stalls.
- December 8–9 — the FOMC meeting. A December hike would push back on the rate relief; a hold would let the weekly declines run.
- December 9 — NAR’s November existing-home sales. The next sales report lands the same week: it covers closings from September–October contracts, so expect it to stay weak whatever rates do now.
- December 10 — the November CPI. The inflation reading that decides whether December’s meeting is the end of the hikes or another step.
The bottom line
October’s existing-home sales — 3.75 million, down 5.5%, the lowest since August 2010 — are what 7.33% mortgage rates do to a housing market: buyers signed in August and September looked at a $2,292 monthly payment on a median-priced home and, in record numbers, walked away. Prices have not followed sales down because sellers are locked in too, and inventory is only now building to 5.1 months. The first relief is visible in Freddie Mac’s 7.11% — worth about $50 a month against October’s average — but the December Fed meeting decides whether that relief lasts. If you are buying, negotiate like a buyer in a frozen market, because that is the market the data describes. This article is educational only and is not financial advice; speak with a licensed mortgage professional about your own situation.
Frequently asked questions
How low did existing-home sales fall in October?
Existing-home sales fell 5.5% from September to a seasonally adjusted annual rate of 3.75 million — the lowest since August 2010, down 8.8% from a year earlier, and below the 3.85 million pace economists polled by Reuters had expected.
Why did home sales hit a 16-year low?
The 30-year fixed mortgage rate averaged 7.33% in October and peaked near 7.40% mid-month — the highest since 2000 outside a single month in 2023, in NAR chief economist Lawrence Yun’s words. October closings mostly reflect contracts signed in August and September, when rates were at their worst, and the median price still rose 0.4% from a year earlier, so buyers got no relief from prices either.
What is the median price of an existing home?
The median existing-home price was $416,700 in October — up 0.4% from $414,900 a year earlier, and down 0.4% from September’s $418,200.
How much does a drop from 7.33% to 7.11% save each month?
On the median-priced home with 20% down — a $333,360 loan — principal and interest falls from $2,292.22 a month at 7.33% to $2,242.53 at 7.11%, a saving of $49.69 a month and roughly $17,887 of interest over 30 years.
Are mortgage rates falling now?
Yes, at the latest reading. Freddie Mac’s November 12 survey put the 30-year fixed rate at 7.11% — a fourth straight weekly decline and the lowest since late September. The next test is the Federal Reserve’s December 8–9 meeting.
Related calculators & guides
About the Global Mortgage Calculator Team
The Global Mortgage Calculator Team builds the mortgage, HELOC and refinance calculators on this site and keeps them aligned with how US lenders actually price loans. Every calculator uses the standard amortization formulas set out in our methodology, is tested against worked examples before release, and our rate commentary is tied to published data — Freddie Mac's weekly survey and Federal Reserve releases — never to opinion.